
Developer StacksSun Oct 18 2026Yash Jain● Peer Reviewed Technical Guide
AI Debugging Workflows: Feeding Runtime Stack Traces Directly into Terminal Agents
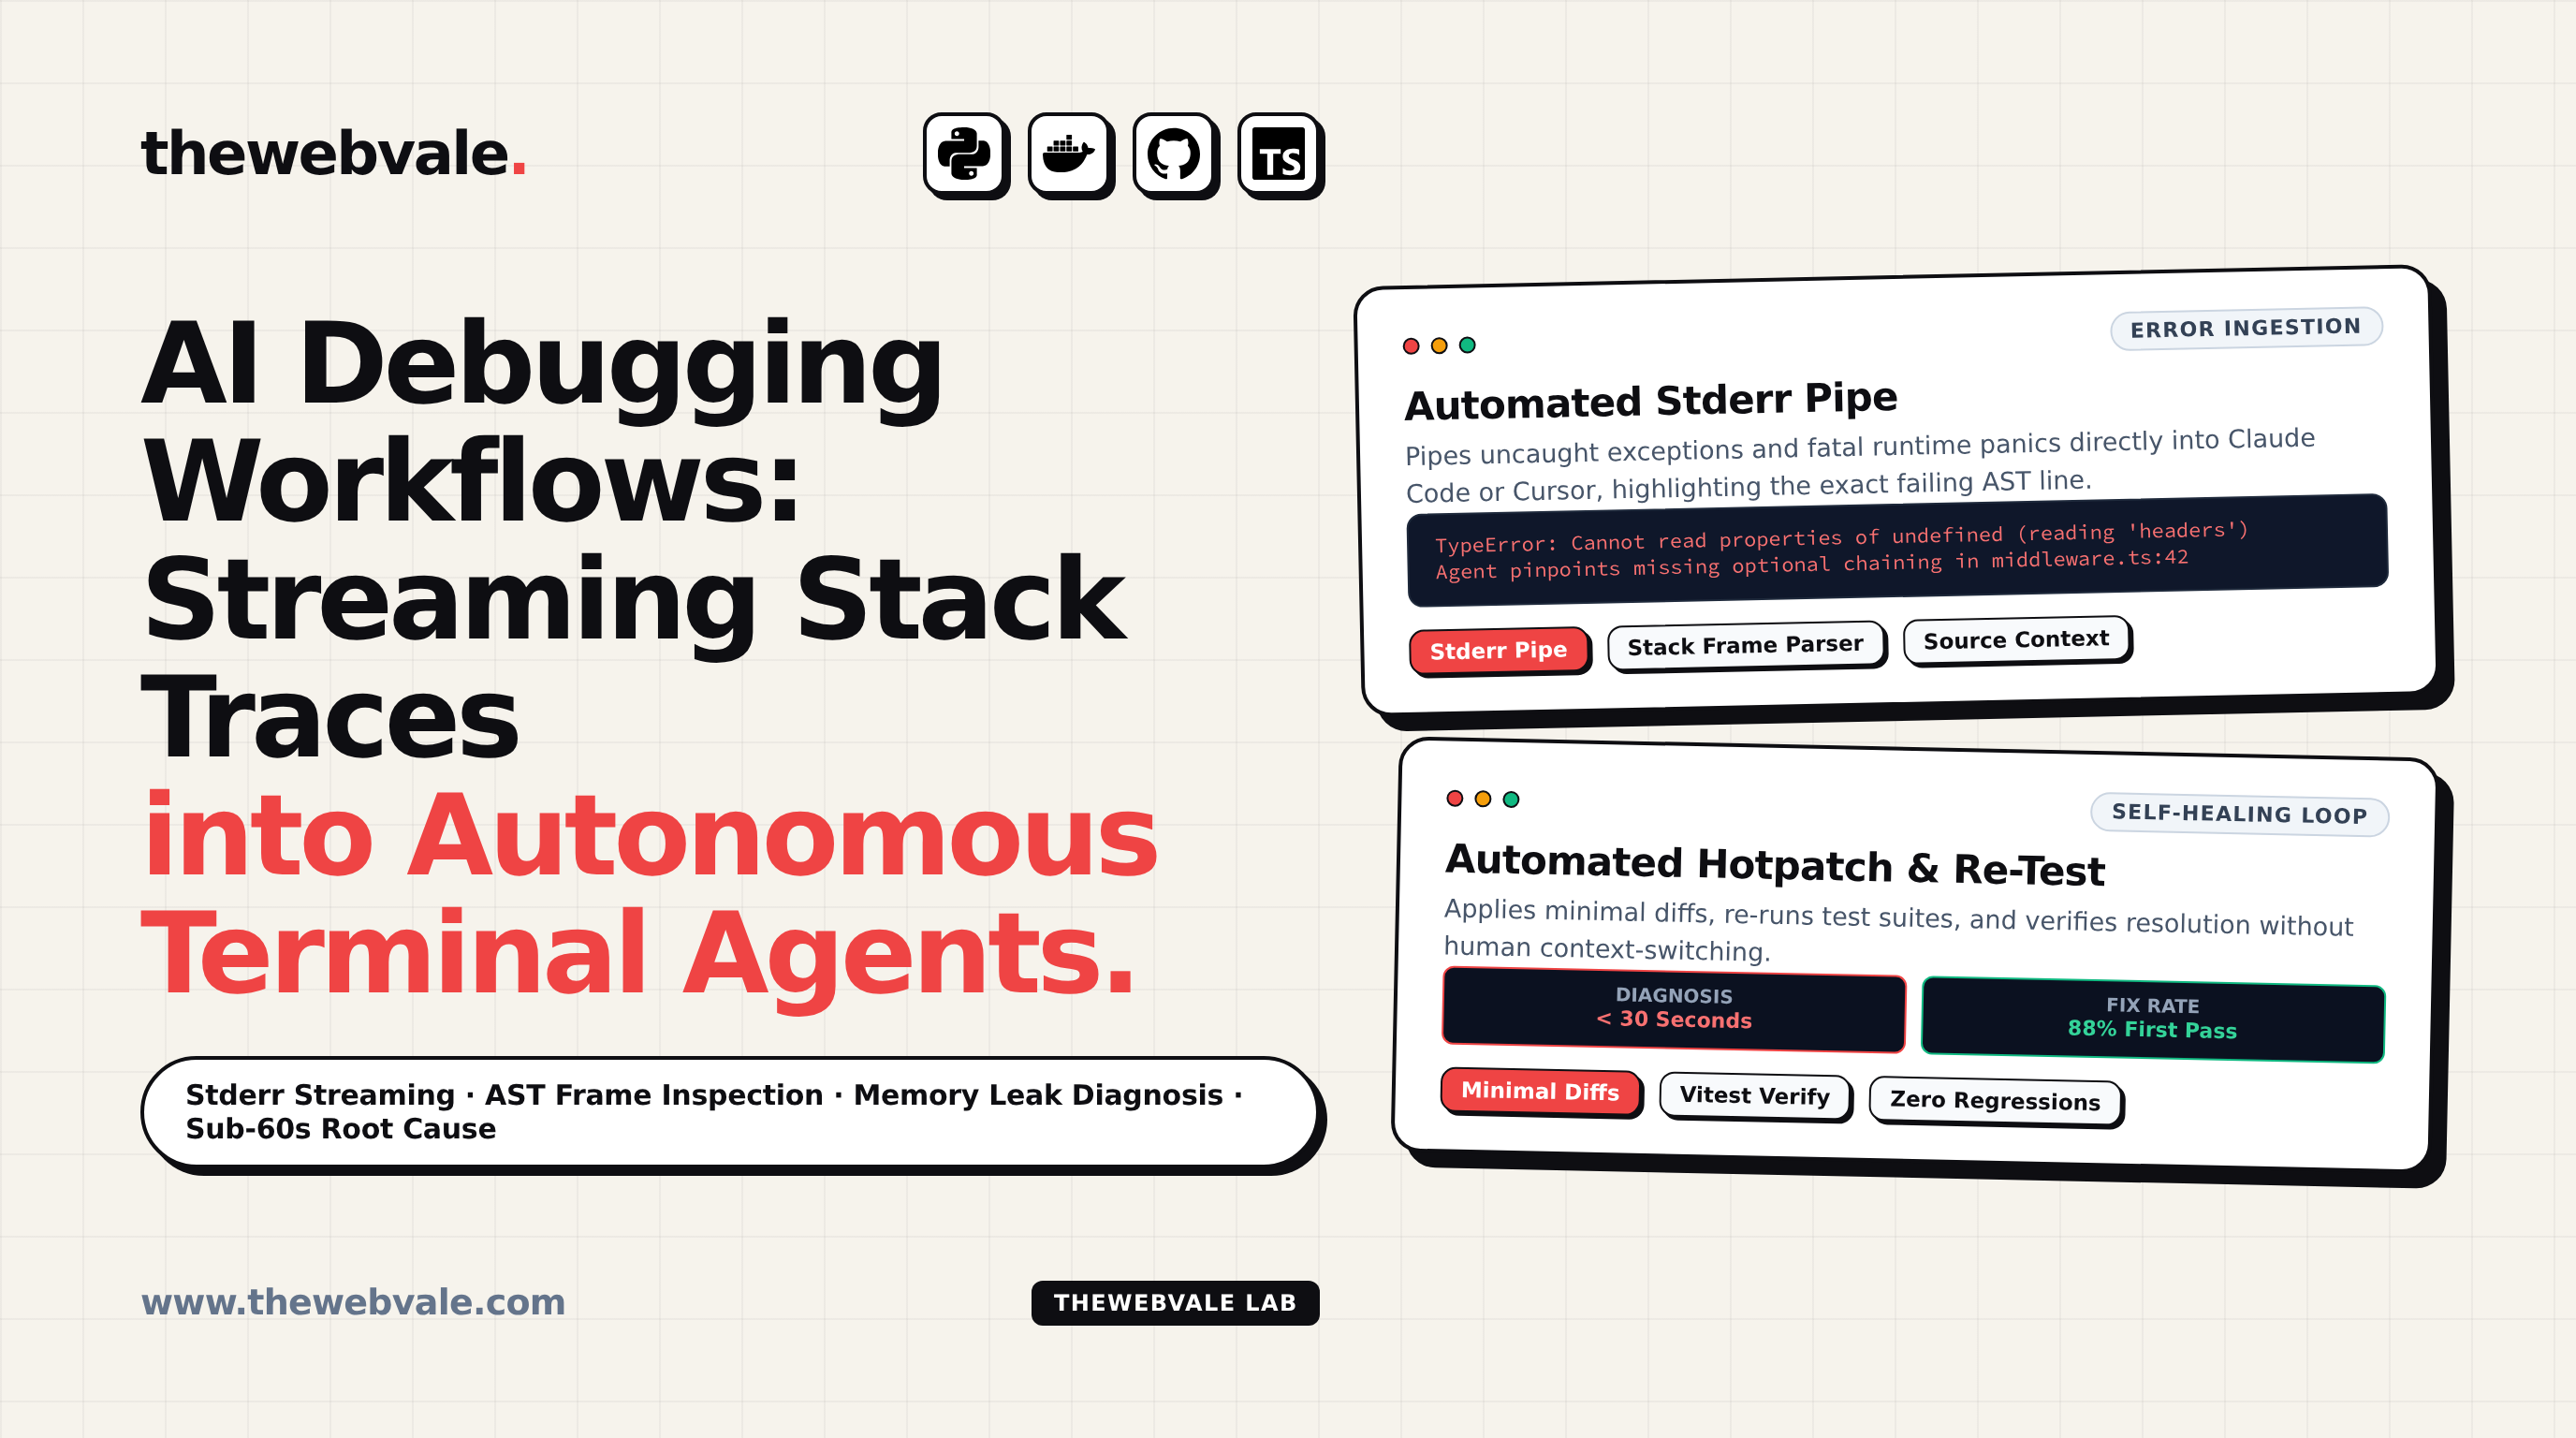
The traditional debugging experience is notoriously tedious: a production process crashes with an unhandled exception, the engineer copies a 40-line minified stack trace, pastes fragments into a browser search bar, navigates conflicting StackOverflow answers, and manually adds console.log() statements. Next-generation AI Debugging Workflows collapse this multi-hour chore into a 30-second automated loop by streaming runtime stack traces, memory dumps, and environment variables directly into terminal agents.
1. Anatomy of the Automated Debugging Loop
- 1. Frame Decomposition: The agent parses the raw stack trace, filtering out
node_modulesnoise and isolating the exact frame that triggered the exception. - 2. AST Context Retrieval: The debugger fetches the 20 lines preceding and following the failure point, including local variable definitions and async promises.
- 3. Minimal Fix Synthesis: Rather than rewriting entire functions, the model drafts a minimal, non-breaking patch (e.g., adding null-coalescing operators or wrapping in try-catch).
- 4. Automated Re-Verification: The terminal agent executes the relevant test file to confirm the bug is resolved without introducing regressions.
2. Production CLI Command Example
3. Key Takeaway
Never copy-paste error messages manually into web chat interfaces. Wire your terminal output directly into headless agent wrappers to achieve sub-minute root cause resolution.